Design - Infographics
I loves me some good infographics! Distilling a complex set of data into an intuitively understandable visual presentation is such a fun challenge. The first is a print poster and insert, the second is a diagram for a research report, and the third appeared in a bear safety manual.
![](https://cdn.myportfolio.com/ae69e4567068fffc6a1ba71baffaa498/37c93f3d-bfef-46df-a08a-5ec5badfb3a7_rw_1920.jpeg?h=5c13914ad60326dc86d5e994fd47aa06)
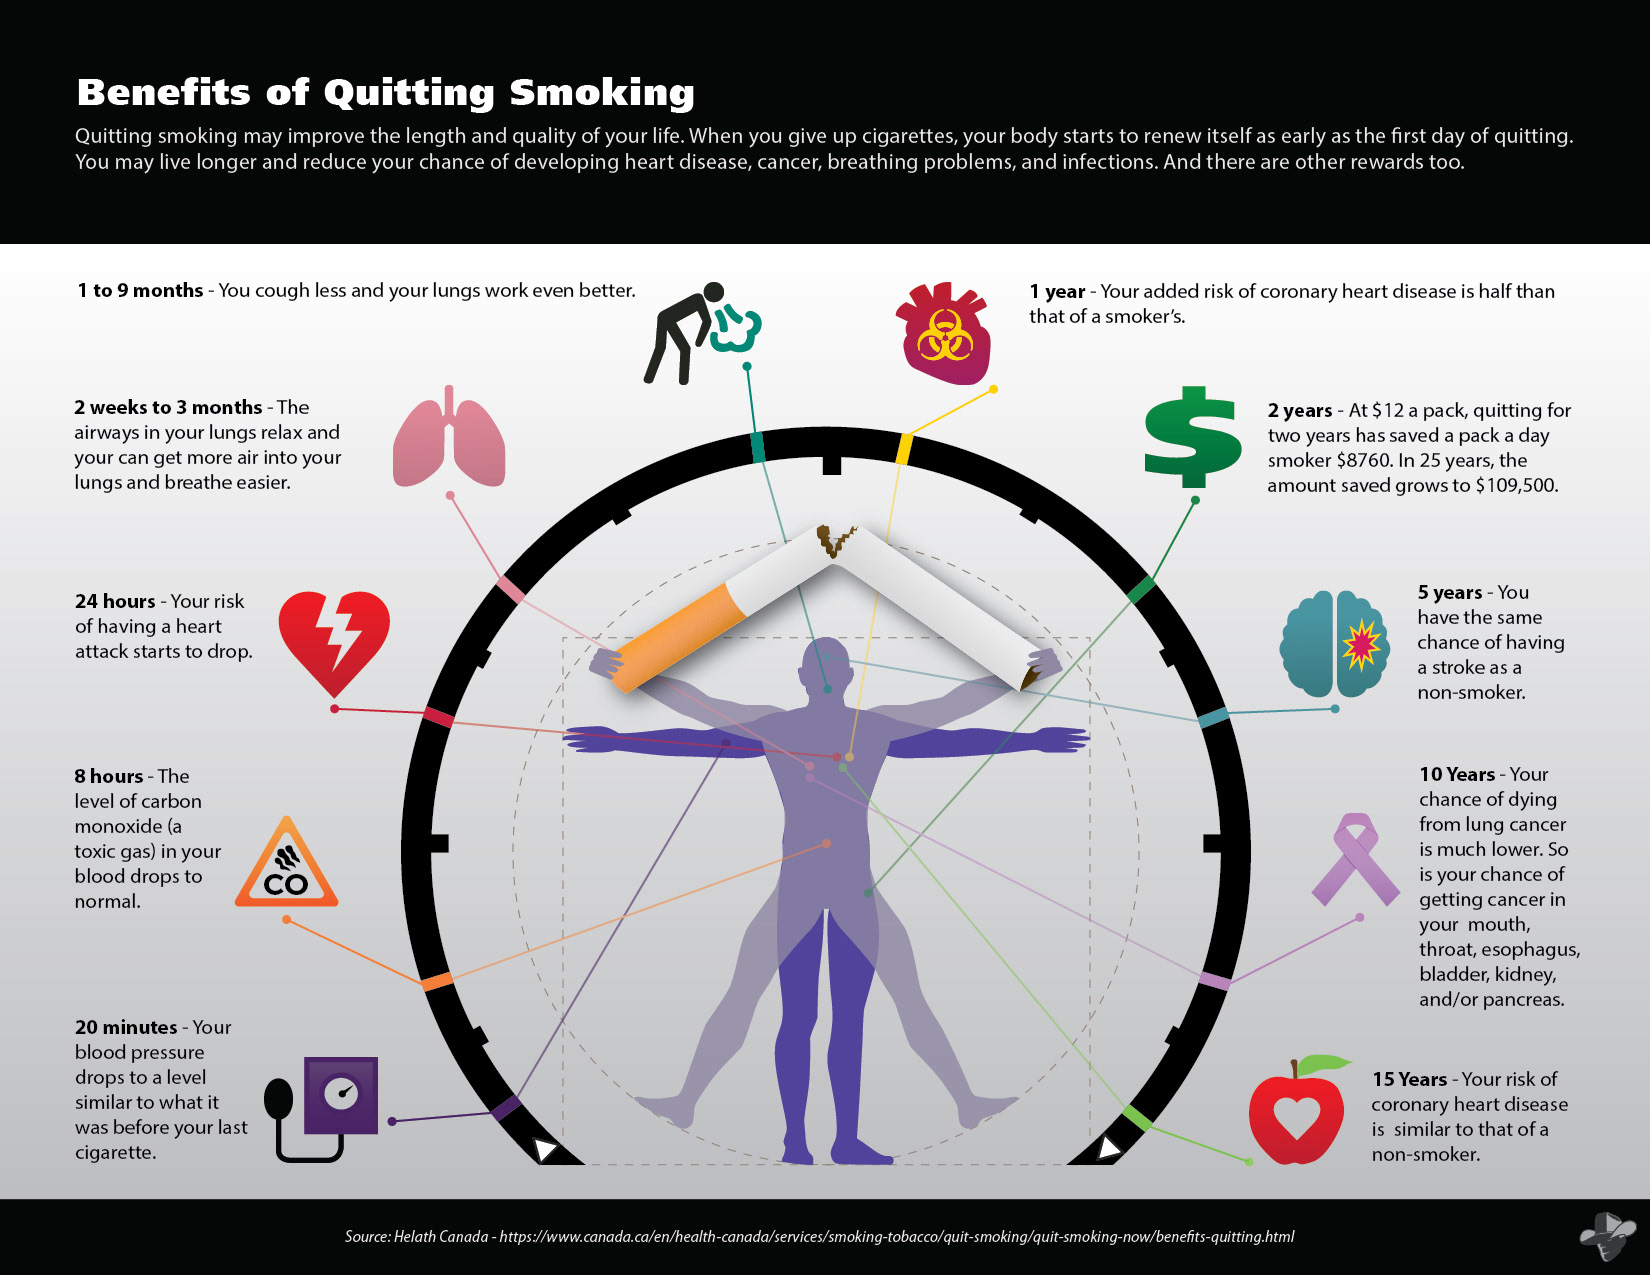
Smoking Cessation Infographic
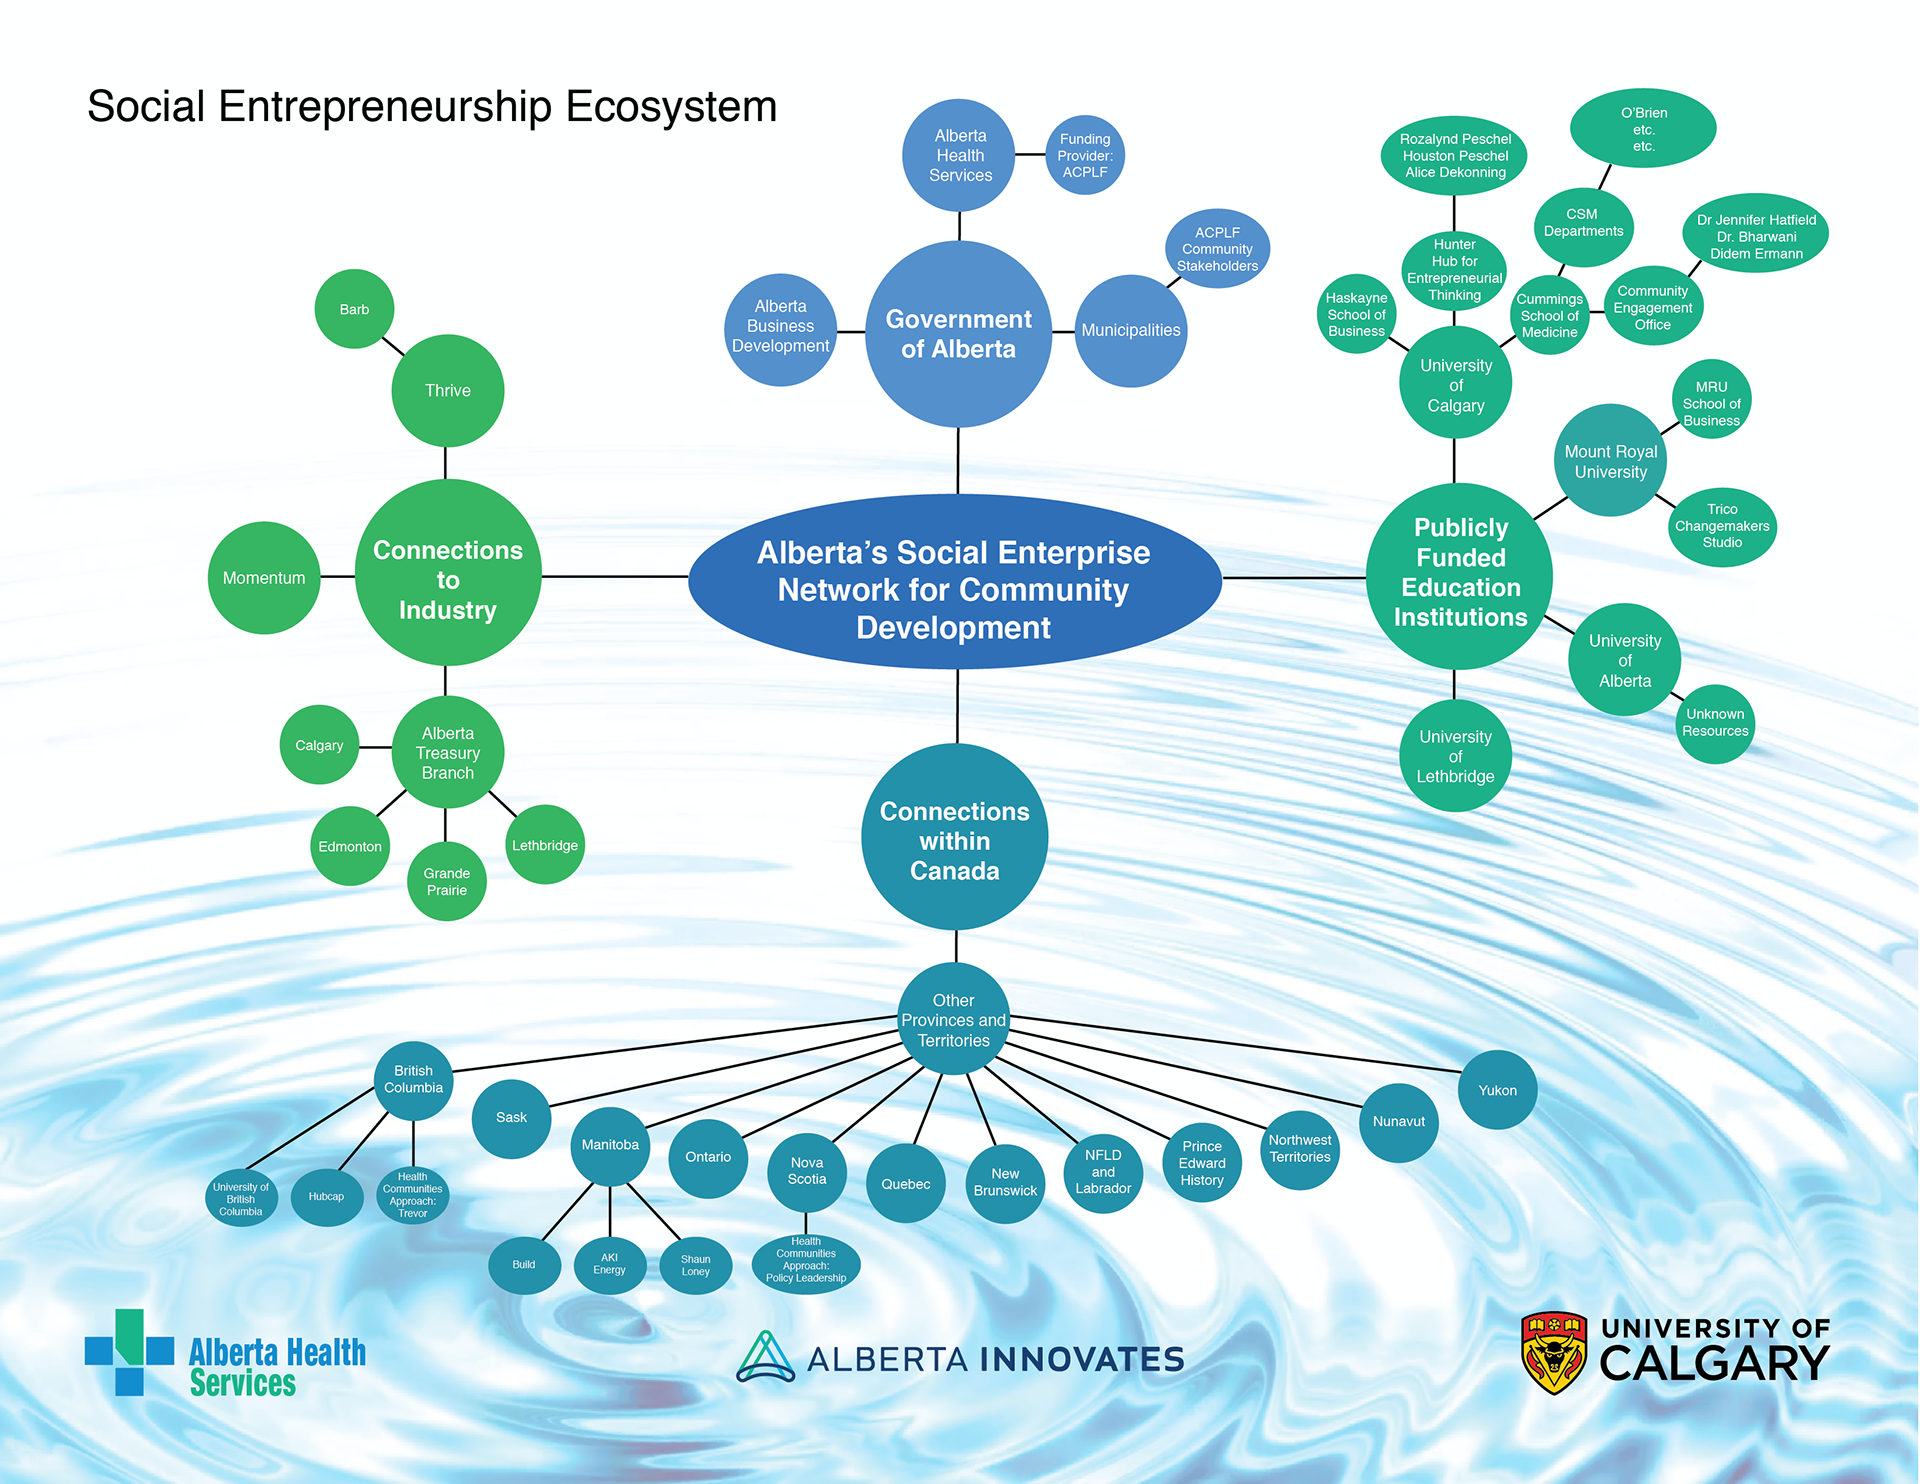
![](https://cdn.myportfolio.com/ae69e4567068fffc6a1ba71baffaa498/346c73cd-c906-4ade-b81d-1085628f9567_rw_1920.png?h=5d64246eb16d84d873b3121e8747f4f6)
Research Diagram
![](https://cdn.myportfolio.com/ae69e4567068fffc6a1ba71baffaa498/e0194196-f2b8-4f18-80ea-d382990200b0_rw_1920.jpeg?h=8d06ca4e35cfe9a0d4609923c9bcdd83)
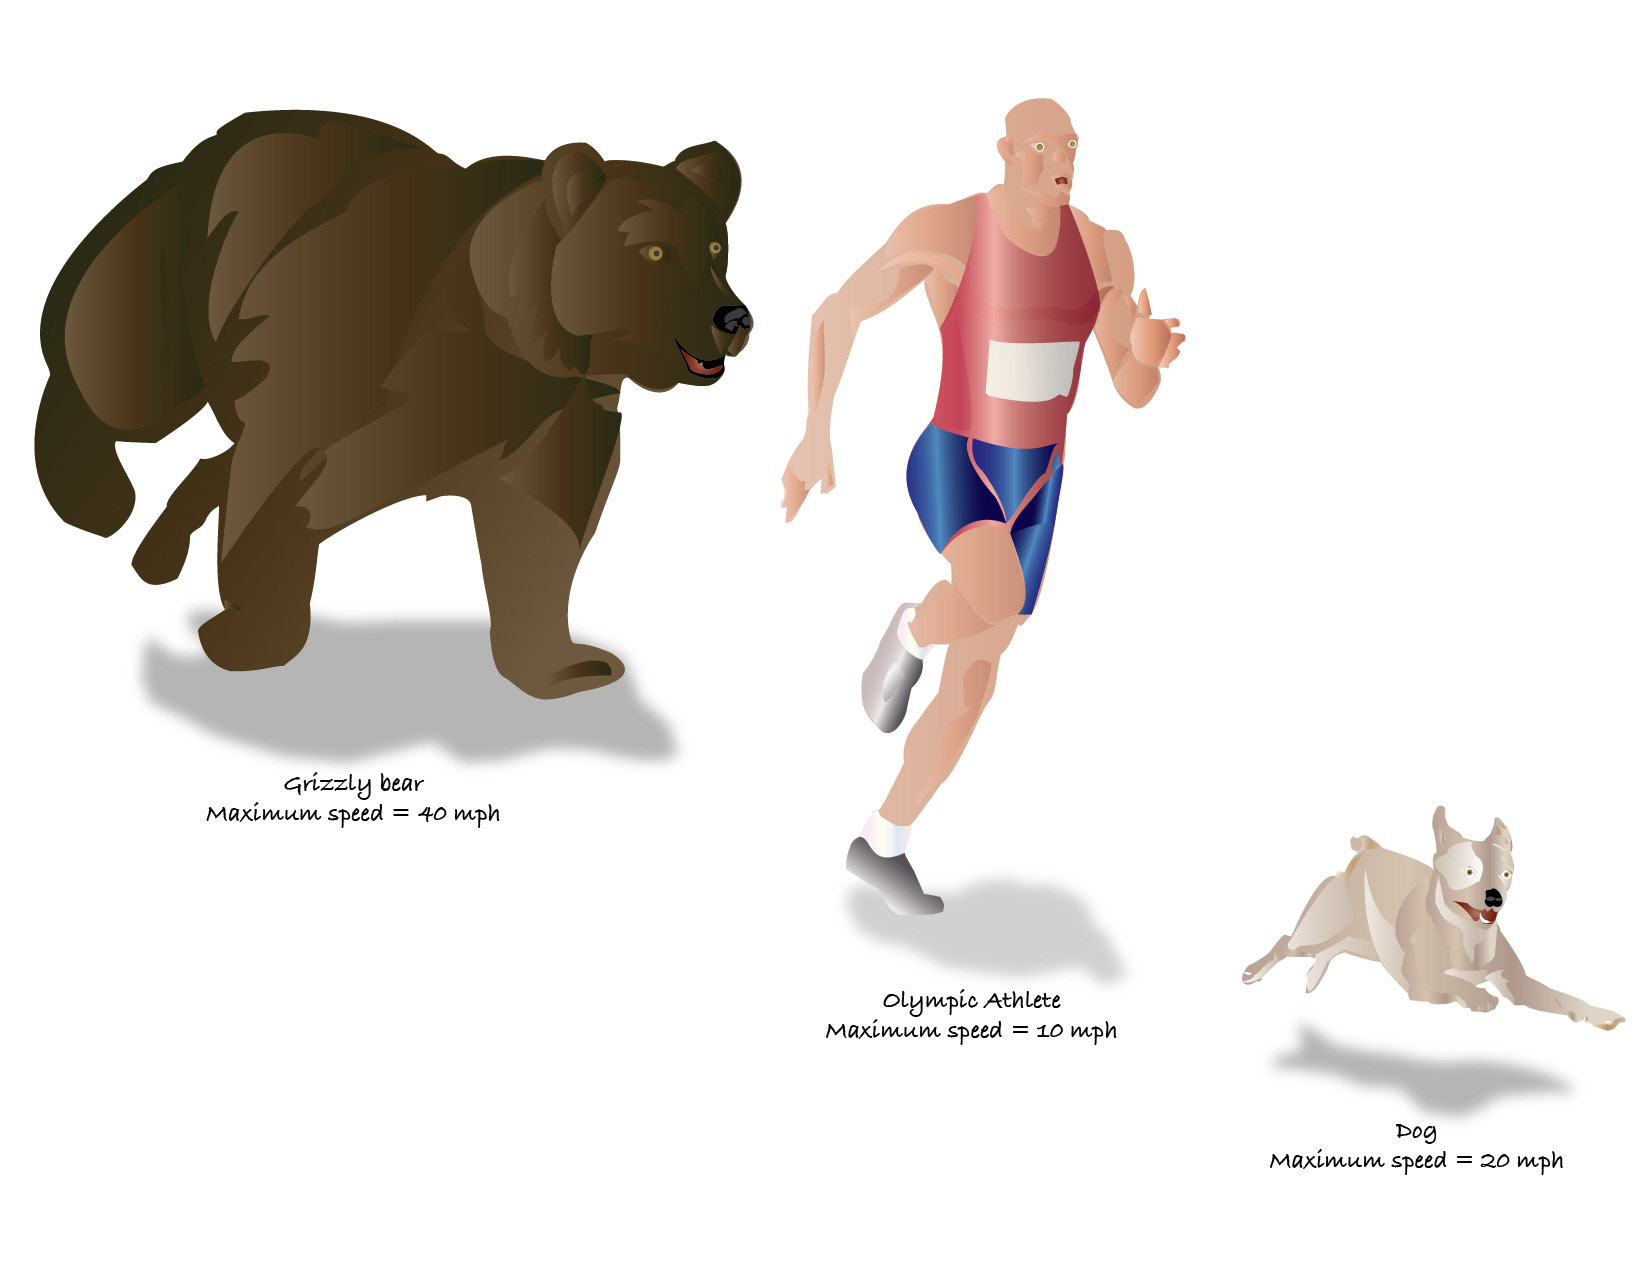
Relative Bear Speed Infographic